Potholes, Peeling Paint, and Padlocked Restrooms: Grading South Bay's Public Infrastructure
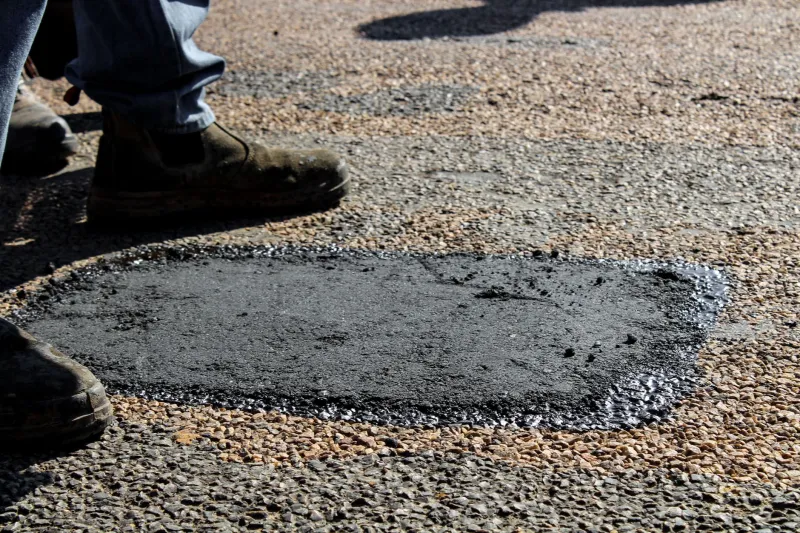
Drive through enough South Bay neighborhoods and a pattern starts to emerge. In some areas, the parks are freshly mowed, the library hours are intact, and the roads don't rattle your fillings loose. In others, you'll find cracked asphalt patched with crumbling tar snakes, park bathrooms locked since 2022, and library branches operating on skeleton schedules because the HVAC blew out and no one's gotten around to fixing it.
So what actually separates the cities that maintain their public assets from the ones that don't? We dug into municipal budget documents, public works reports, and deferred maintenance logs across several South Bay communities — and the results are telling.
How We Looked at This
Evaluating infrastructure upkeep across multiple cities isn't an exact science. Budget categories vary, accounting methods differ, and some cities are more forthcoming with their data than others. For this piece, we focused on three core categories: road maintenance spending per lane mile, parks and recreation facility upkeep as a percentage of total parks budget, and library capital expenditures relative to facility age.
We also talked to residents — the people who actually use these spaces every day — to get a ground-level read on what the numbers do and don't capture.
The Cities Pulling Their Weight
A handful of South Bay municipalities stand out for taking a genuinely proactive approach. These cities tend to share a few things in common: they've adopted formal asset management plans, they fund maintenance at recommended levels rather than deferring to future budgets, and they treat upkeep as an ongoing operating expense rather than a one-time capital project.
Residents in these communities notice the difference. "I've lived here for 22 years and the park two blocks from my house has never looked bad for more than a week or two," said one longtime homeowner in a well-maintained South Bay neighborhood. "Someone always shows up."
That consistency doesn't happen by accident. It reflects deliberate budget prioritization — and, in some cases, voter-approved maintenance funds that created dedicated revenue streams insulated from the annual budget fight.
The Cities Falling Behind
On the other end of the spectrum, several South Bay cities are carrying what budget wonks call "deferred maintenance liabilities" — essentially, the accumulated cost of repairs they've been kicking down the road for years. When you delay fixing a roof, a parking lot, or a water main, the eventual repair bill multiplies. A $40,000 fix today can become a $200,000 emergency replacement in five years.
Residents in these areas are frustrated — and they're not shy about saying so.
"The road in front of my house has been patched so many times it looks like a quilt," said one South Bay resident who asked not to be identified by name. "Every time I bring it up at a city council meeting, I get a very polished non-answer about funding challenges."
Public records requests in several of these cities revealed maintenance backlogs running into the tens of millions of dollars — figures that rarely make it into official communications with residents.
Libraries: The Canary in the Coal Mine
If you want a quick read on how a city values its public infrastructure, look at its libraries. Library branches are expensive to maintain, easy to cut, and politically difficult to close outright — which means they often become the slow-boil victims of deferred investment.
Across South Bay, library facility conditions vary wildly. Some branches have seen recent renovations, upgraded technology infrastructure, and expanded community programming. Others are running on aging HVAC systems, outdated electrical panels, and roofs that facilities staff describe, diplomatically, as "a concern."
Librarians, for their part, are remarkably candid when you get them off the record. "We make it work," said one South Bay branch staffer. "But there are days when I'm genuinely embarrassed to bring school groups in here because of how the building looks."
Parks: Where Budget Cuts Show Up First
Parks maintenance is another area where the gap between South Bay's best- and worst-performing cities is stark. Turf quality, restroom availability, playground equipment safety, and irrigation system upkeep all reflect the underlying budget reality.
City parks departments have largely borne the brunt of post-pandemic budget squeezes, and in cities without dedicated parks funding, the maintenance backlog has grown quietly while officials focused on higher-profile spending priorities.
A few South Bay cities have bucked this trend by establishing parks maintenance districts or pursuing state grants specifically earmarked for facility upkeep. These mechanisms don't solve everything, but they create a funding floor that prevents the slow deterioration that plagues less-resourced parks systems.
What the Best Cities Are Doing Differently
The South Bay municipalities with the strongest infrastructure track records share some identifiable best practices worth noting:
They publish maintenance schedules publicly. Residents can actually look up when their street is due for resurfacing or when the park restrooms were last inspected.
They fund at the recommended level. Infrastructure asset management guidelines typically recommend annual maintenance spending of 2-4% of asset replacement value. Cities that follow this guidance avoid the compounding costs of deferred maintenance.
They've created dedicated funding streams. Whether through special districts, parcel taxes, or voter-approved measures, the cities doing this well have found ways to protect maintenance budgets from the annual political scramble.
They measure and report outcomes. Pavement condition index scores, facility condition assessments, and library utilization metrics are publicly reported and tied to budget decisions.
The Accountability Gap
Here's the uncomfortable truth: most South Bay residents have no easy way to compare how their city is doing relative to its neighbors. Municipal budget documents are dense, inconsistently formatted, and rarely translated into plain language. Deferred maintenance figures, when they exist at all, are buried in capital improvement plans that few people read.
That opacity is, at least partly, by design. It's a lot easier to explain away a crumbling park restroom when residents don't have a benchmark for what adequate maintenance actually looks like.
Pushing your city to publish a clear infrastructure scorecard — real numbers, real timelines, real accountability — is one of the more impactful things a civically engaged South Bay resident can do. It costs nothing to ask. And the answer, or the refusal to answer, tells you a lot.
Have a tip about infrastructure conditions in your South Bay neighborhood? We want to hear from you.